You want data? You can't handle the data.
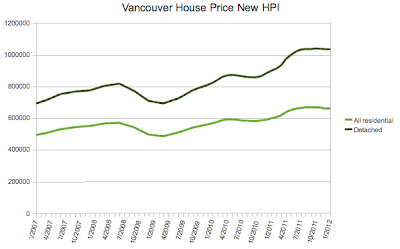
Vancouver's Realtor Board has changed the models they are using to estimate the "true" price of houses. The data only goes back so far and the prices have shifted around. Biggest difference seems to be that the relatively acceleration of the detached is much higher in the new index, soaring to a steamy 1 million and beyond. Oh, that and the recent declines in the old index have turned into noise. Although, it is noise with a downward trend with October 2011 as a peak.
Not sure why the porcupine effect here that emerges in Jan/Feb 2010. Strange.
Nothing to see here. Market is completely stable.
Vancouver's Realtor Board has changed the models they are using to estimate the "true" price of houses. The data only goes back so far and the prices have shifted around. Biggest difference seems to be that the relatively acceleration of the detached is much higher in the new index, soaring to a steamy 1 million and beyond. Oh, that and the recent declines in the old index have turned into noise. Although, it is noise with a downward trend with October 2011 as a peak.
 |
| This is it. That's as far back as it goes in the current archive. |
Not sure why the porcupine effect here that emerges in Jan/Feb 2010. Strange.
Nothing to see here. Market is completely stable.


2 comments:
Porcupine? Try 豪豬 :)
Hedgehog?
Post a Comment